This month I am withdrawing that advocacy. The reason is that TAVFX, with over $5 billion under management, now has over half its assets in just 5 stocks, all in east Asia. Still more alarming, over a third of assets are in just 4 stocks, all Hong Kong real estate investment trusts.
The fund manager’s explanation for this concentration is essentially “China is a growth story.” Ominous. China is a well-managed command economy that grew by exports — exports that will not grow for the foreseeable future. China may instead be the Mother of All Black Swans.
Those four Hong Kong REITs still have all the features that made TAVFX great: strong balance sheet, shares trading well below adjusted book value. They are incredibly good companies, selling incredibly cheap — hence the concentration. And this will probably do well. Probably. But it is too much risk concentration. There are easier ways to make a buck — mainly by going to smaller cap investments.
]]>18.61% BlackRock:Gl Res;A
17.85% Fidelity Sel Brokerage
17.35% Fidelity Sel Home Fin
17.20% Bruce Fund
17.14% Fidelity Lw-Prcd Stk
17.11% Fidelity Sel Software
17.01% Fidelity Sel Elctronic
16.94% Heartland: Value
16.78% Vanguard Energy;Inv
16.63% Cohen & Steers Realty
16.58% Fidelity Sel Enrgy Ser
16.55% JennDry Jenn Ntl Res;A
16.49% FPA Capital
16.37% Fidelity Sel Financial
16.34% Vanguard HlthCare;Inv
16.09% Royce Fd:Micr-Cp;Inv
For comparison, my favorite old warhorse, Third Avenue Value Fund (TAVFX), has higher 3-year compounded annual growth rate (CAGR) of around 19%, but much lower 10-year rate of about 13%.
In the list above, I discount the sector plays (real estate, energy, health care) because they simply rode a rising tide in those sectors, and it’s thus unreasonable to extrapolate performance. Industry sectors cannot outperform forever, so you would need to be able to predict when to switch out of these and into the next big sector. If you could do that, you would be running a mutual fund, not investing in one. So ignore the sector plays.
This narrows the field of top performers to just Bruce Fund (BRUFX), Fidelity Low-Priced Stock (FLPSX), Heartland Value (HRTVX), FPA Capital (FPPTX), and Royce Micro Capital Trust (RMT).
Of those, the FLPSX strategy seems silly, RMT is closed to new investors, small-caps are currently bid way up (HRTVX). Drop those, and we’re left with just BRUFX and FPPTX.
Conclusion: I still like TAVFX because I have a clear idea how they do what they do. But if I understood BRUFX and FPPTX a bit better, I might like them better than TAVFX.
]]>She depended upon constantly rising asset prices to cover her negative cash flow.
Today the buzz in Orange County cafes is strikingly similar, along the lines of, “sure hope I can sell my house in Lake Perris — I need the money to pay my variable-rate mortgage in Irvine.”
Plus ca change, plus c’est la meme chose. If you have never personally lived through an investment bubble — that is, have never watched your friends and relatives wipe out — it’s naturally difficult to recognize the signals. House flippers, you may want to review these personal observations from Silicon Valley in 1999.
Ask yourself honestly: doesn’t this sound pretty familiar?
When, you may ask, does it end? With websites like “condoflip.com” inviting you to buy and resell property that isn’t even finished yet, you have to wonder if the end is near.
But if this were knowable, bubbles would not occur. The reign of unreason is by definition unpredictable. Flipping might work for 3 more months, or 3 more years. All that can be said with certainty is that negative cash flow is unsustainable, and corrects itself one way or another.
When the end does arrive, it plays out quickly. There is no single precipitating reason — buyers suddenly dry up and the musical chairs game stops. Whoever still holds inflated assets is ruined in a “race for the exits,” to use a phrase popular in Palo Alto in autumn 2000. Most of the instant wealth in Silicon Valley was lost within 18 months after the peak.
Yes, property prices move more slowly, and inflation may even disguise a real decline beneath a nominal increase. But the debt load is huge, so the impact may be more severe. Who keeps paying that mortgage when there is negative cash flow and no prospect of an exit?
One last salient feature of investment bubbles: the smart money gets out first. Warren Buffett, the most successful living investor and noted for rarely selling any investment, recently unloaded a Laguna Beach home he had owned for 30 years. He actually joked at the Berkshire Hathaway shareholders’ meeting in May 2005 about how overpriced the property was. Charlie Munger, chairman of Wesco Financial in Pasadena and an L.A. real estate investor for over 40 years, chimed in that the smartest people he knew were selling all but their best properties in the L.A. area. A friend of mine at Pimco, the bond fund in Newport Beach, tells me some investment analysts there are actually selling their primary residences.
Ask yourself, house flippers: are you a smarter investor than Warren Buffett? Do you know more about interest rates and mortgages than an analyst at the world’s largest bond fund?
If not, you might consider this a good time to begin that race for the exits.
]]>In effect, the only thing left, by process of elimination, is to hold a diversified portfolio of old-fashioned value stocks and short term bonds, denominated in various currencies, including the dollar. There are three inexpensive ways I can think of to do that.
First is Berkshire Hathaway (BRK.A and BRK.B). Everyone knows Berkshire owns big chunks of many high-profile consumer brands in the U.S., from See’s Candies to Coke to Gillette. But there are some less-known features of Berkshire that make it attractive for all of our diversification goals.
* You can think of Berkshire as a sort of mutual fund in corporate form. It is diversified, though not as much as a mutual fund, and has very low expenses.
* The company’s key assets these days are actually not consumer brands, but rather well-run insurance companies, many with global operations.
* Berkshire’s chairman and vice-chairman, Warren Buffett and Charlie Munger, have been bearish on the dollar for years, and began diversifying out at least as early as summer 2002. They currently hold $20 billion in non-dollar cash and short-term instruments, though this probably understates the true number, since Berkshire’s controlled investment vehicles (again, mainly insurance companies) can be expected to be similarly hedged.
You should not expect Berkshire to deliver its historically amazing 40-year performance of over 20% compounded. Neither the company’s scale nor the pricing of the stock market support that today. However, you can think of Berkshire as a strategy to avoid losing money: it’s an inexpensive way to hedge simultaneously against risk of inflation, a dollar fall, and a fall in average PE ratios of US stocks.
Many professional managers of value-oriented hedge funds are currently holding large amounts of Berkshire Hathaway as an alternative to cash or short-term bonds, for essentially the same reasons outlined here. But they charge 1% per year, while you can easily do the same thing yourself by simply buying Berkshire into your brokerage account.
The second idea is Third Avenue Value Fund (TAVFX). Third Avenue is the only long-running, successful value fund that’s still open to new investors, as far as I’m aware (if you know of another with at least a 15-year published record of results, please write me or append a comment to this article).
Third Avenue is fanatical about buying securities on the cheap. They hold a nice mix of stocks and bonds, US and foreign assets, but above all, their basis is low for everything they own. They are an illustration of research showing that a disciplined value approach tends to outperform growth over time: their performance is something like 17% annualized for 20 years, and they’ve had only one down year. The expense ratio is quite low, which is one reason for their high performance.
A third alternative — which I offer with some reservations — is to hold a value index fund such as Vanguard Small Cap Value Index. I’m less excited about it, partly because it’s not a dollar hedge, but also because their definition of value is, I believe, relative; that is, they simply select the cheaper stocks from whatever happens to be available.
The risk in Vanguard’s relative value index approach is that, in today’s expensive market, even the cheapest half of public stocks are still pretty expensive. Higher-than average PE results in lower-than-average return (see this recent article). Better in my view to hold a disciplined, managed value fund, that is truly buying things cheap on an absolute basis, at least until the market as a whole approaches a historical norm.
Ask your investment adviser if you’re likely to lose a lot of money by putting a third of your assets in Berkshire, and two thirds in Third Avenue.
]]>Below is a 125-year history of the S&P500 index (or, prior to 1926, its large-cap equivalent), rendered as a set of monthly 20-year periods. Each point in the graph shows a 20-year compound return versus the PE10 ratio of the index (price divided by the 10-year trailing average of earnings plus dividends) at the beginning of that period.
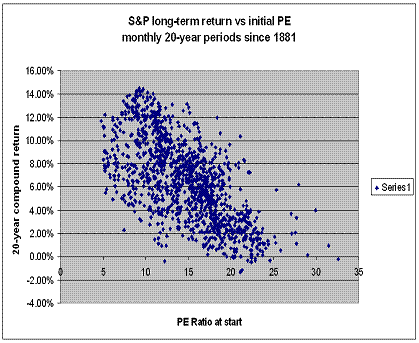
The implication is that you can estimate — very roughly — the 20-year future return of the S&P500 based on just one piece of information: its PE ratio today.
As you can see — and subject to potential statistical biases below — the graph appears to show that if you invest in index funds when their aggregate PE ratio is greater than about 20, you should have low expectations about the result.
More ominously, the graph shows that, over the past 125 years, if you purchased an index fund with a PE of at least 24, and held it for 20 years, you would rarely have made more than 3% per annum. I say “ominous” because the S&P index is that expensive right now.
How can you apply this to money management? One way might be to hold more short-term Treasuries when the index looks too expensive. Let’s look at how that strategy might have performed over the past century.
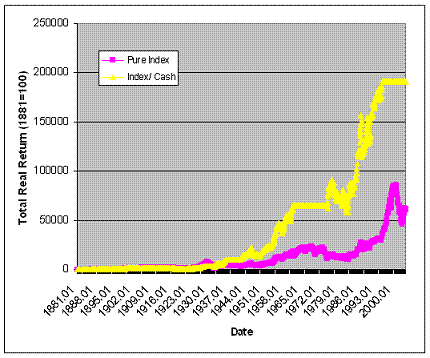
The pink line shows the real, inflation-adjusted result of simply holding the S&P 500 for 125 years. The yellow line shows the real result of buying the index whenever its PE ratio is less than 9, and selling it (going to Treasuries) whenever the index PE ratio is greater than 22. (This chart makes one big simplifying assumption, namely that the risk-free rate is the same as the inflation rate, i.e. the real return on Treasuries is zero. I don’t believe this detracts from the conclusions.)
As you can see, the PE-based asset allocation strategy resulted in a much better total return. The advantage varies, but generally exists for any long period over the past 125 years.
Note also that, under this strategy, you would automatically have sat out the crashes of ‘29, ‘37 and ‘74, with no false positives.
Now for the hard part: you would have spent years sitting on the sidelines. The 1960’s, for example. Perhaps most of your working life. Many people would prefer to play “the only game in town,” even if it’s rigged against them.
Another little problem, at least if you’re an investment manager, is that this strategy required only 9 trades in 125 years! Hard to charge your advisees 1% per year for that kind of advice!
Academically, there is the little problem that this graph flies in the face of modern portfolio theory in general, and the capital asset pricing model (CAPM) in particular. CAPM, as any MBA will attest, says that over the long term, the more risky asset (index alone) should outperform the less risky one (index plus cash). Here we have a 125-year timeline suggesting otherwise.
Why the difference from CAPM? Because CAPM assumes that assets are always priced rationally in relation to their risk. If whole asset classes can become overpriced relative to their long-term return (as appears periodically to be the case with stocks), and if you can identify that fact, then CAPM breaks down.
Another problem is practical: this model has been screaming “go to cash” since June 1995. Let’s say you’re 40 years old today. Based on the first chart above, index funds appear likely to offer a real return of 3% for the rest of your working life. Research shows that mutual funds and hedge funds generally do worse than index funds.
And, finally, there is a less obvious problem: this latter graph shows the result of lump-sum investing, rather than dollar-cost averaging over time, which is what most people do. It turns out that dollar-cost averaging into the index DOES beat market timing over most long periods.
I think the right conclusions to draw from this are as follows:
1. Buying low PE results in much higher return than buying high PE.
2. Dollar cost averaging is more powerful than market timing, even in the long term.
How does this translate into an investing strategy for today’s expensive markets? See the next article for more.
]]>Generally formed during the 1975-90 real estate boom, RELPs are not corporations, but limited partnerships managed by a general partner. They own income property, such as apartment buildings or storage units, collect rent on them, and pay out some of the profits to their unit-holders (analogous to shareholders). Limited partner unit interests can be purchased, just like shares of common stock, from specialized brokers. Many partnerships pay periodic distributions — analogous to dividends — and the yields can be very attractive, given that the partnerships often sell at substantial discounts to the market value of their assets.
Let’s restate that last point for emphasis: some of these partnerships deliver cash returns of 8% to 10% per year, yet they sell for as much as 20% less than the value of their own assets. It’s like buying a dollar bill for 80 cents, and then collecting interest of 6 cents a year on top of that. “A satisfactory return with adequate safety of principal,” as Benjamin Graham might say.
How can such an opportunity exist? Well, there are a few reasons. First, many of these partnerships are publicly registered, but not listed on any exchange. So you need to hunt around a bit even to find a broker who will help you buy them. Second, once you have them, they’re illiquid — it might take days or weeks to sell them at a fair price. And third, unitholders do not have the same rights as common shareholders. Among other things, the general partner may have special rights, including the ability to wind up the partnership, cancel payouts, et cetera. So this is an area where you really need to do your homework to get good results.
But the results can indeed be good. For example, Public Storage Properties V yielded over 8% to price in 2003, yet sold at a discount of 15% to 20% of its asset value.
Perhaps the biggest risk here would be of overpaying for units. This is the flip side of market inefficiency: because there is no quoted price, an unwary buyer could unwittingly pay much more than intrinsic value. One needs to be able and willing to do basic financial analysis to make such a purchase safely.
Just to be clear, this is completely different from investing in new limited partnerships. Instead, we are talking about buying interests “second-hand” in longstanding partnerships. We make this distinction because there are a lot of promoters out there selling new partnership interests, which are of highly variable quality.
Again, this is a tiny, little-known niche in the investment universe, with a total trading volume in 2003 of well under $100 million. Because the capitalizations are so low, large institutions don’t even look at them — leaving mispricing opportunities for the small income investor willing to do some homework.
]]>My opinion is no. But his question threw me off guard, because it’s more complex than it looks. Here are the issues at hand.
If you’re a homeowner who reads his junk mail, you probably already know about interest-only loans. Terms vary, but generally, these are 30-year adjustable-rate mortgages (ARMs) with a 3 to 7 year “teaser” period in which you pay only interest, no principal, at a low fixed rate.
The stock market returned over 20% last year, while the teaser rate on a 7/1 interest-only ARM is only 5%. So my friend figured he could set aside an extra $1,500 a month by refinancing, and put that money into a rising market. By the time the mortgage went back to adjustible-rate, seven years later, he would be sitting on a huge pile of money — about a quarter million dollars, if current stock market returns hold up. Later, if interest rates had risen, he could use the money to pay down principal. If not, he could continue to invest.
Right? Yes, as far as it goes. The question is, “where are the hidden assumptions?”
Here, the underlying assumptions are (i) that stocks will go up faster than the additional interest you’re paying, net of the tax benefit (mortgage interest is deductible); and (ii) that mortgage rates won’t hit the roof between now and the homeowner’s reversion to variable-rate 7 years from now.
In my opinion, these conditions are far from assured. It’s conceivable (likely, according to some experienced money managers) that stocks will return no more than 5% in coming years. If that happened, and if mortgage rates rose even one or two points in the interim (which is nearly certain), then this re-fi strategy would result in a loss of capital.
One more yellow flag on this strategy is a historical one: the last time interest-only mortgages were this popular was the late 1920s, when homeowners used them to — you guessed it — invest the extra cash flow into the stock market. After 1929, these people lost most of the money they had invested, leaving them with no cushion as the economy went down. Many lost their homes.
OK, maybe there’s no Great Depression coming, and I’m not arguing you’ll lose your home as a result of an unfavorable re-fi. But it is generally agreed that the stock market looks expensive. Investing with your home equity might not be the best idea.
Now, you have to keep in mind that this law partner’s net worth is higher than mine! So consider me a suspect source. As usual, ultimately you just have to look at the respective arguments and make your own judgment.
]]>First, you could buy extremely short-term paper, either directly or in the form of money markets. This is debt, issued by governments or corporations, that is paid off in a matter of a few months, limiting your exposure to sudden shifts in interest rates.
Some advisers suggest investing in TIPS, which are inflation-protected U.S. government bonds. The thinking is that, since interest rates basically move in response to inflation, you are somewhat protected against interest rate moves.
I don’t agree with this reasoning, because the Federal Reserve has clearly stated their intention to prevent inflation by raising interest rates. If you believe them, then the logical conclusion is that TIPS will fall in value as yields rise.
You could invest in foreign TIPS, such as the French OATies discussed recently. This would protect you from a fall in the dollar, and to a lesser extent from inflation. BUT, it wouldn’t protect you from a RISE in the dollar, which could occur if interest rates shot up. The only good news here is that recent reports suggest the European Union is less inclined to raise rates in response to inflation.
The best alternative, in my mind, is probably a basket of short-term paper in various currencies. In coming weeks I’ll be researching this in detail, and will reveal my findings here…
]]>In 1934, Graham intoned, “An investment operation is one which, upon thorough analysis, promises safety of principal and a satisfactory return. Operations not meeting these requirements are speculative.”
Graham’s classic book, Security Analysis, was written in 1934, soon after the market crash of ‘29. Like Philip Fisher and the investing community at large, Graham was hurt badly in the crash. Like Fisher, but unlike the investor community, he went into the market heavily during the market’s nadir in the early 30s, and had already made out well by the late 30s, even before the Depression was over.
So Graham’s definition of investing is forged by the Depression, and sounds sort of like the Hippocratic Oath: first, do no harm to your principal. Whatever you do, don’t take a poorly understood or significant risk of losing your money, whether by overpaying or by buying something excessively speculative.
Think about what acts as a rational basis for the price you are paying, because that’s what will act as a floor when a shock comes.
For example, what is the company’s tangible net worth? How stable are earnings? How does the earnings yield compare to debt instruments of similar risk?
If you invest individually, make sure you understand the basics about what happens when the economy has a major shock, or the company you’re invested in has serious problems.
For example, do you know how your securities will be valued if the underlying company goes bankrupt? Many people simply don’t know that stock, especially common stock, is usually worthless after a bankruptcy, while bonds, particularly senior bonds, can retain much of their value.
A great source of information is the Securities Exchange Commission. Hey, you’re already paying for it in the form of taxes — might as well visit and read what they have to say about protecting your own wealth.
]]>This week, I read the phrase “all assets are too expensive” in no less than four major publications: the Los Angeles Times, the Wall Street Journal, Forbes and Barron’s.
I’m reminded of a great passage from “Developing an Investment Philosophy,” a 1980 book by one of Buffett’s thought leaders, the late Philip Fisher.
Fisher correctly called the 1929 crash in a paper he published at an investment bank in summer of that year. His reputation as a genius was tempered, however, by the fact that he was wiped out in the next 2 years by the market decline.
How could that happen? The same way it’s about to happen to all of us today. Everyone seems to agree that everything is overvalued, but no one has the guts to simply sit out.
There are a few. Berkshire Hathaway is out, to the degree it can be.
What can you do to sit out? Well, you can go to cash. You can hold bonds — but they’d better be short term, because interest rates are set to rise. Or you can hold shares that are priced low relative to their asset values.
A good example of the latter would be Riviera Tool Company (RTC). I don’t own it and am not recommending it — this is just an example of a Graham-style investment. No long term debt to speak of, they survived the 2001-2002 nuclear winter, and they are cheap, cheap, cheap. P/E of under 9, and selling for less than book value. Insiders are buying.
Now think for a moment about what happens here if the dollar collapses. Do tool & die manufacturers become better off? Sure. Suddenly the heat from east Asia and Germany is gone.
Graham said it all 70 years ago: when a stock is selling for less than its net assets, you’ll have a hard time losing money.
]]>